Mathematical Research Data Initiative, Issue 6
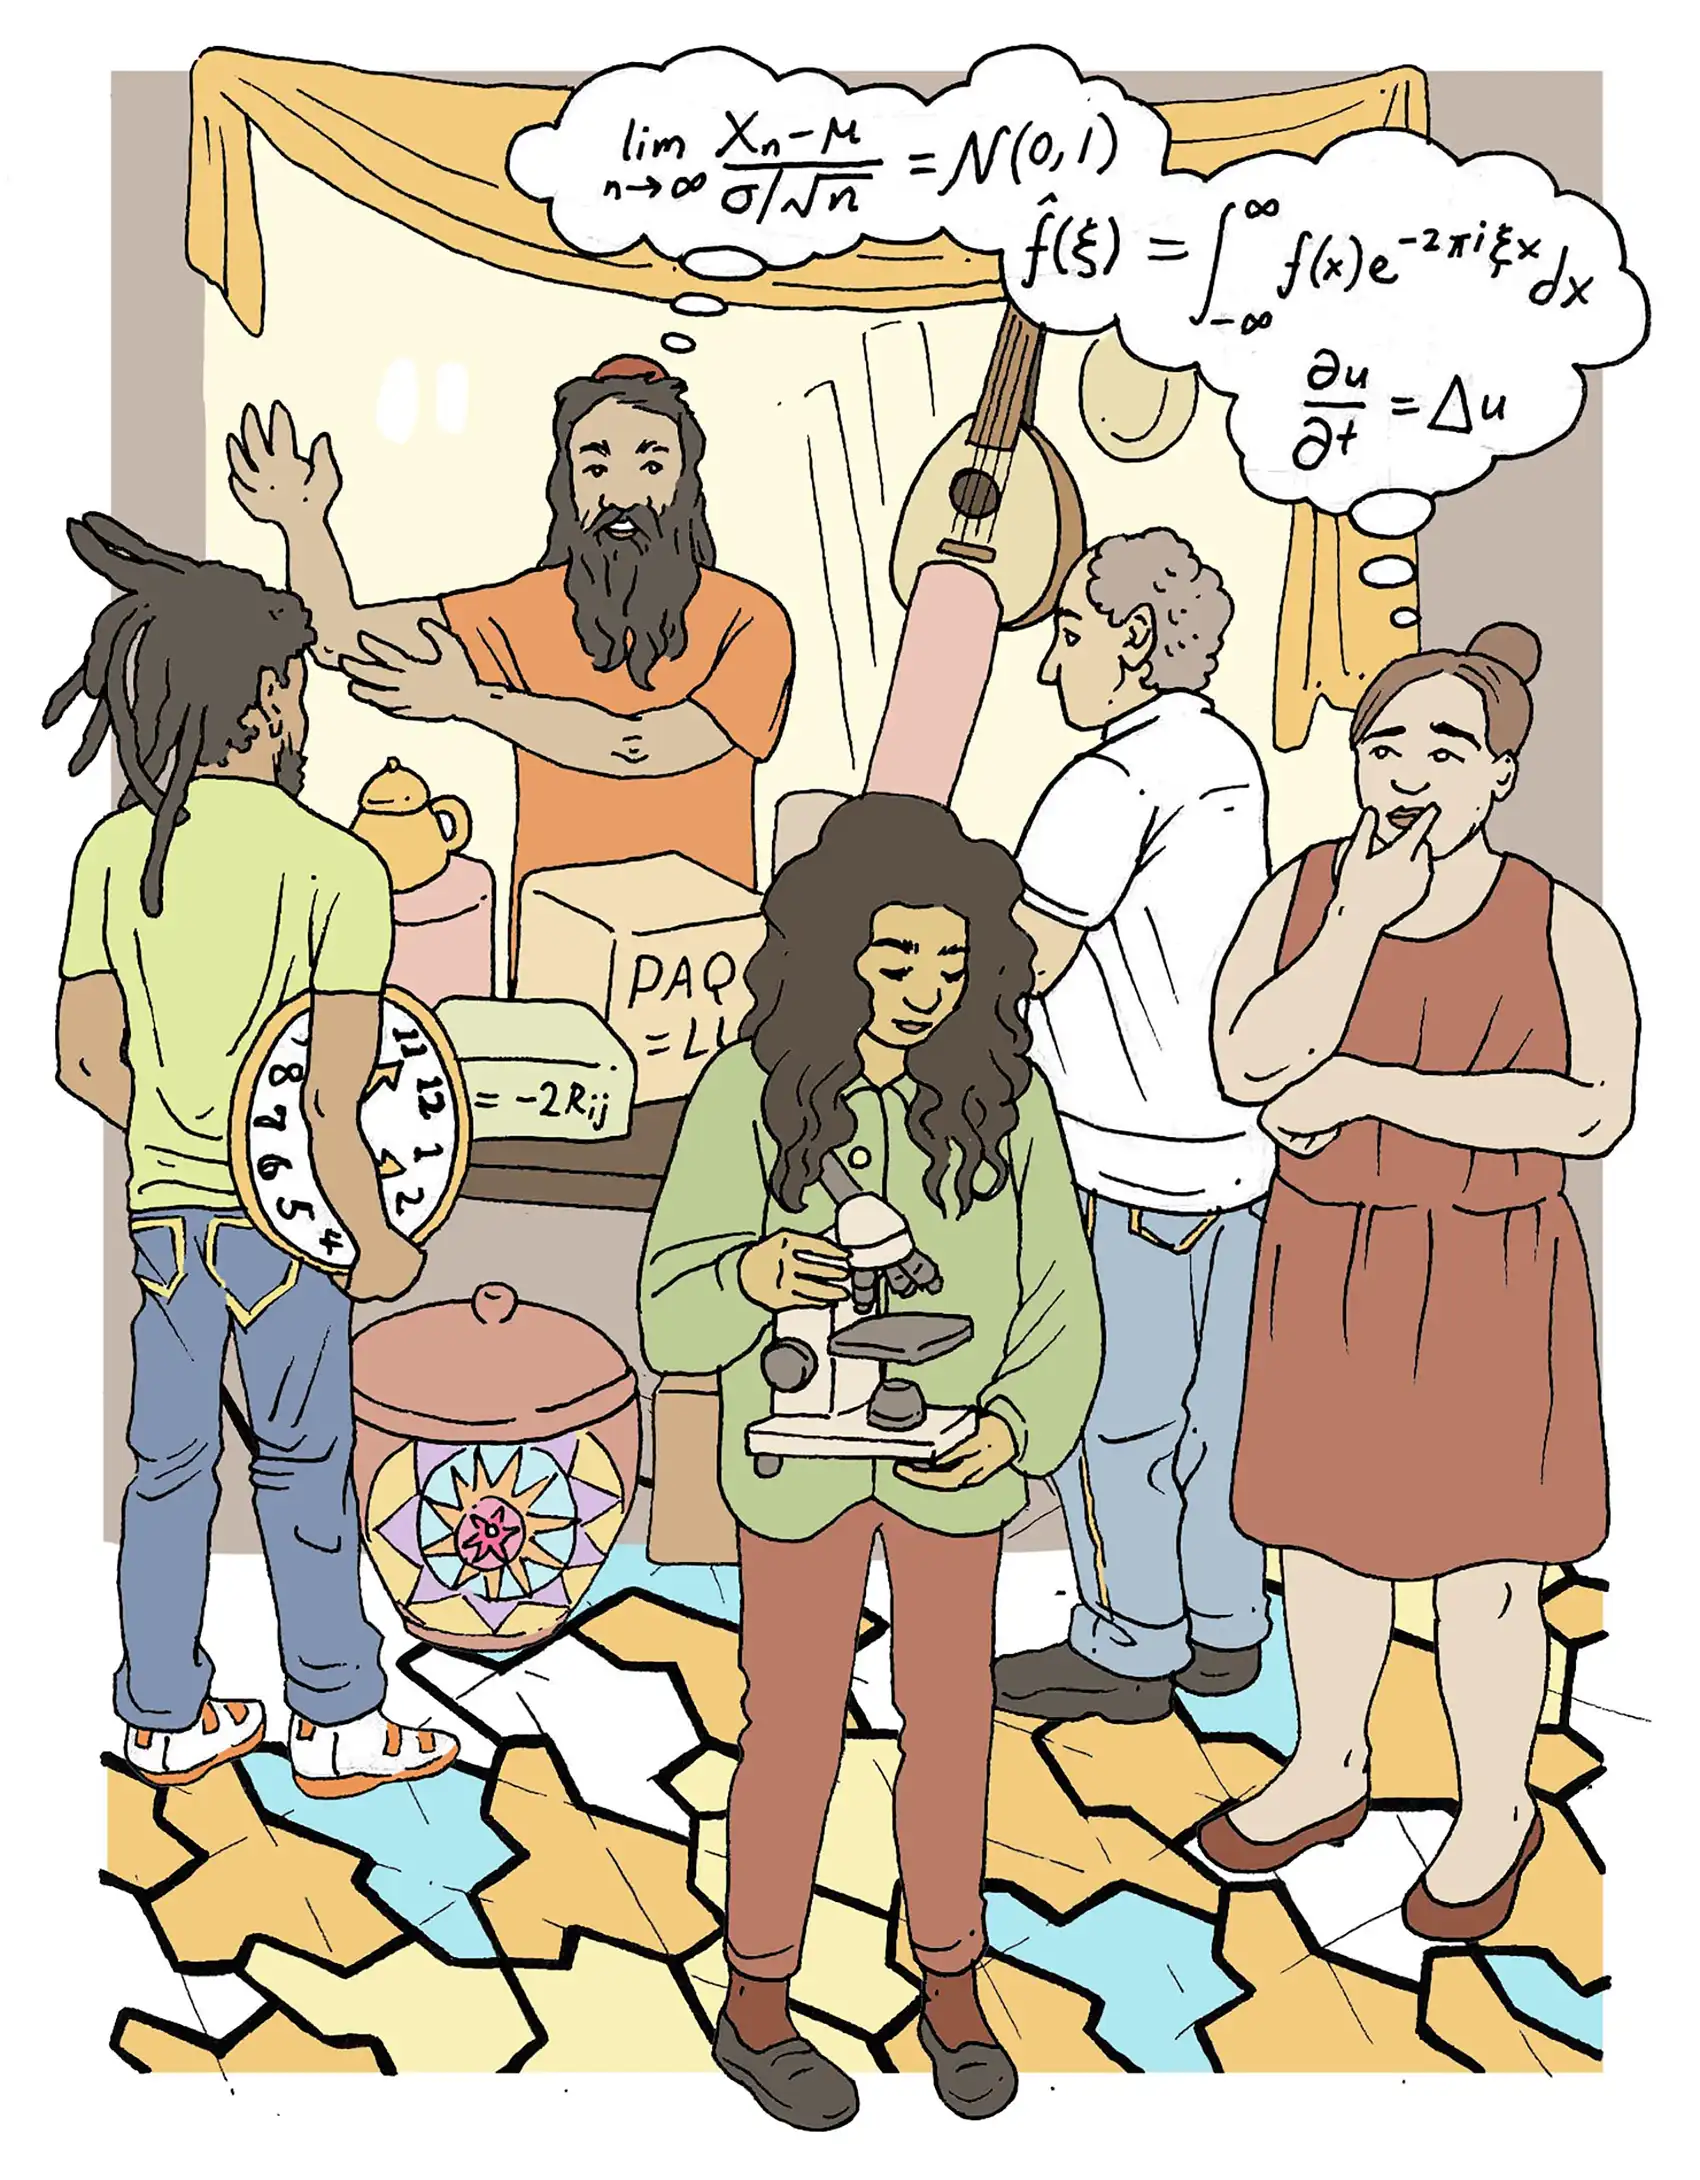
This illustration was commissioned for the September 2023 MaRDI newsletter. I was requested to create a drawing of a marketplace as an analogy for research data in mathematics, to show how this data can come from a variety of sources. I inserted a handful of mathematical diagrams and research artifacts, such as an E8 lie diagram, a telescope, and an aperiodic monotile on the floor. I modeled the market and the people in it after a typical scene inside an Israeli shuk.