Mathematical Research Data Initiative, Issue 17
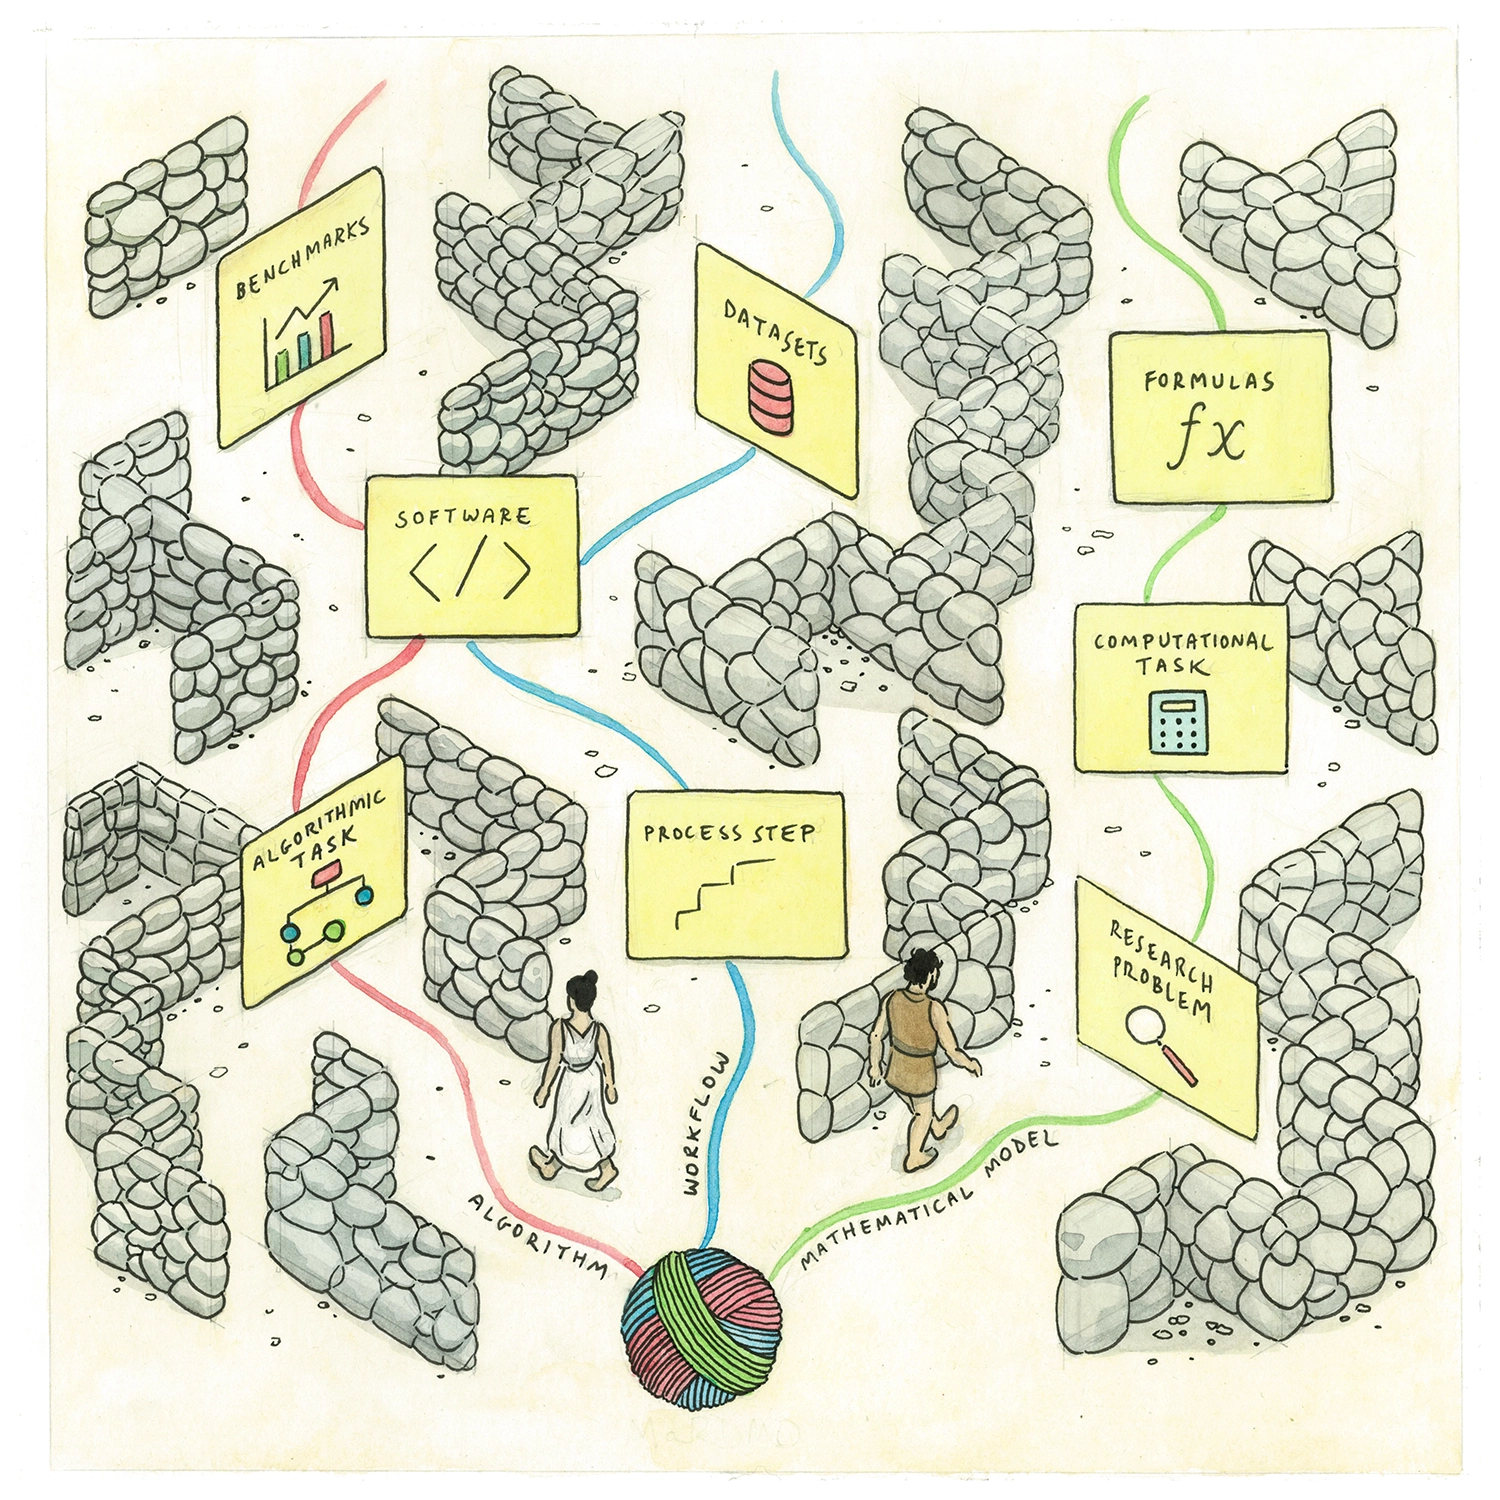
This illustration is for the 17th edition of MaRDI’s quarterly newsletter, which talks about a service that uses questionnaires to help users add data points to knowledge graphs or find something in the knowledge graphs. The client wanted me to represent this process using an ancient Greek labyrinth. I have always been partial to isometric views, so I went with that here.